
A Practical DBA Experiment by PetaCore Tech
- At PetaCore Tech, we believe the best way to understand PostgreSQL is through real execution, not theory alone. In this blog, we walk through a practical experiment involving:
- 01. Table creation and data loading
- 02. Query planning and cost estimation
- 03. Parallel execution behavior
- 04. Index impact on performance
- 05. Memory tuning using
work_mem
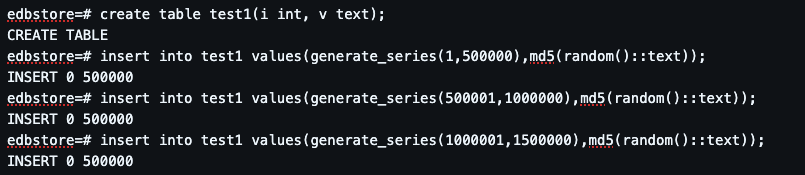
Step 1: Creating and Loading Data
Then we insert 1.5 million rows using generate_series():
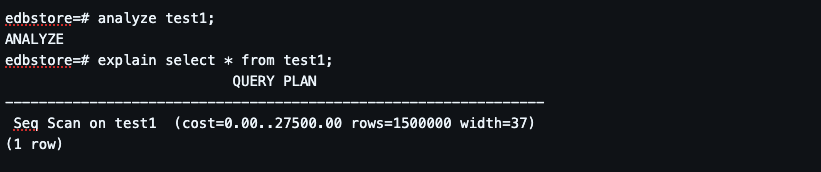
Step 2: Query Execution Plan (Seq Scan)
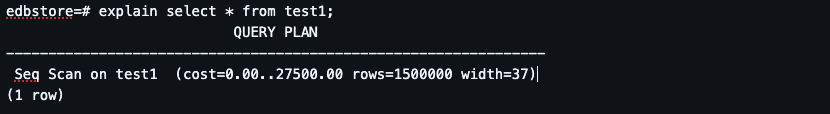
PostgreSQL chooses Sequential Scan Because no index exists It estimates full table read is cheapest
Step 3: Understanding Planner Statistics
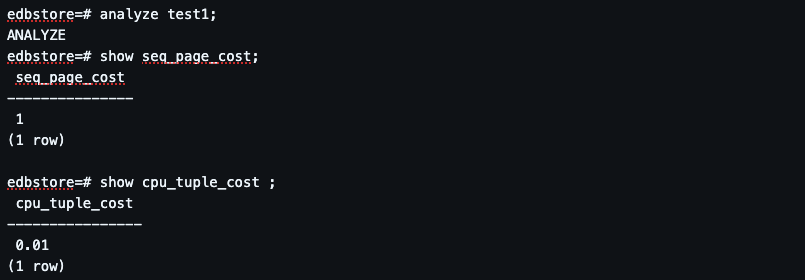
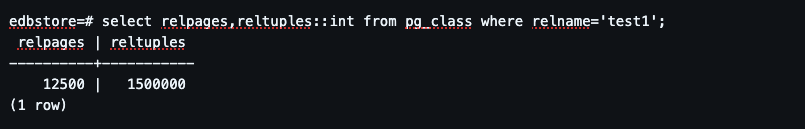
Step 4: Cost Model Understanding.
PostgreSQL uses a cost formula:
CPU tuple processing cost (cpu_tuple_cost)
Disk access cost (seq_page_cost)
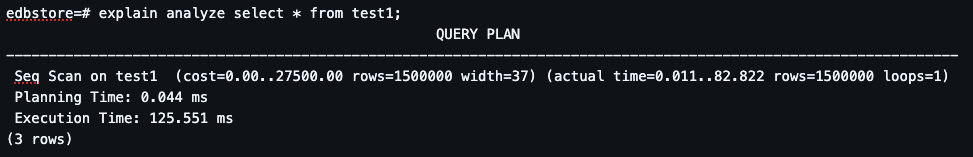
Step 5: Actual Execution Analysis.
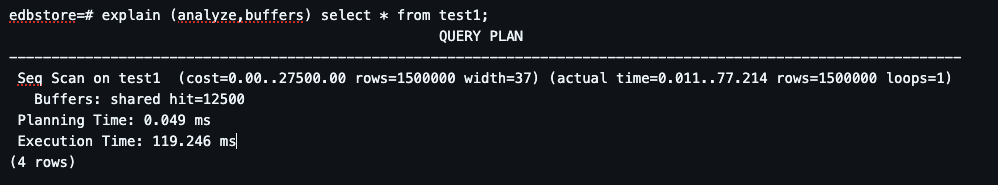
Execution Time: ~119 ms Buffers: shared hit. Data is mostly served from memory. No disk bottleneck observed
Step 6: Parallel Query Execution.
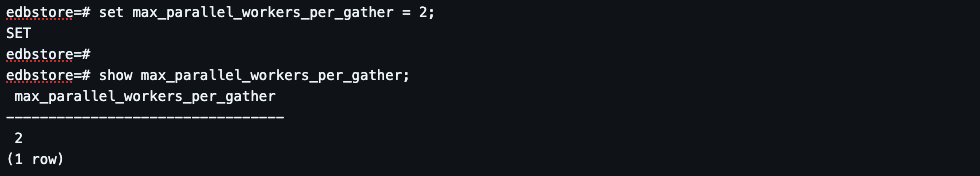
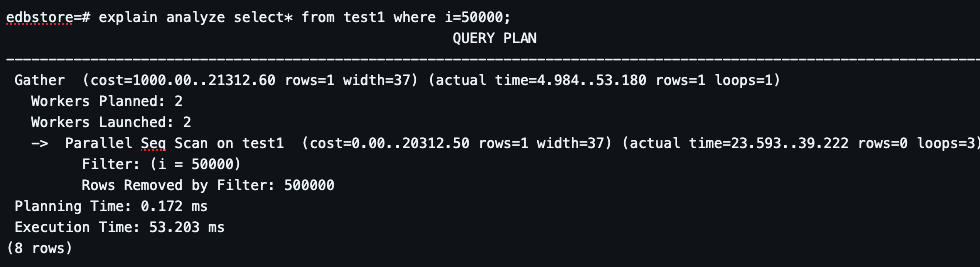
Parallel Seq Scan activated Work split across workers Faster than single scan.Parallel execution reduces latency. But still scans full dataset
Step 7: Index Impact (Game Changer).
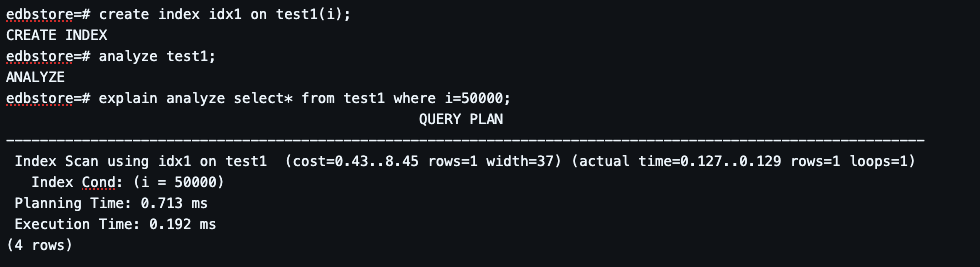
Huge performance improvement. From full scan → direct lookup. Cost drops dramatically
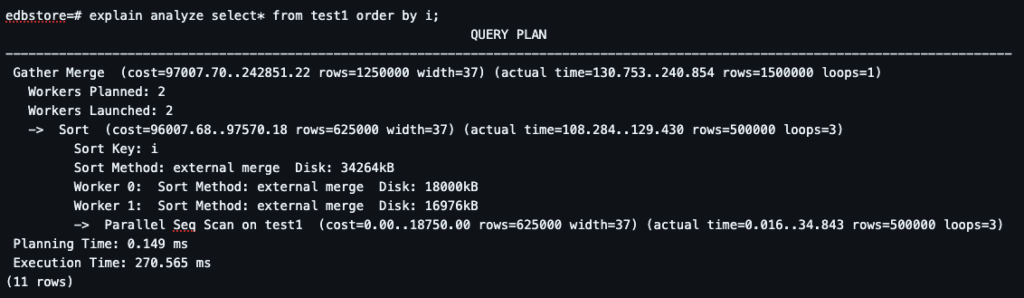
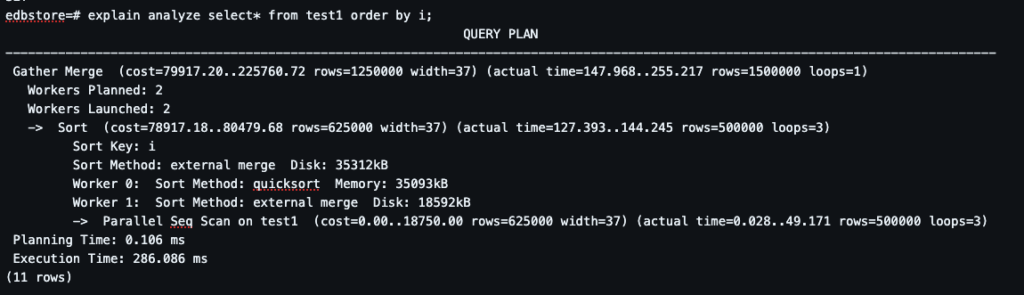
Step 8: Sorting Without Index (Heavy Operation)

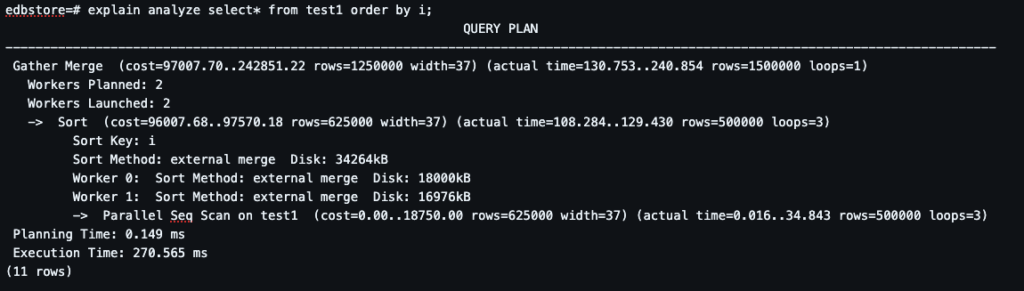
Step 9: Understanding work_mem.
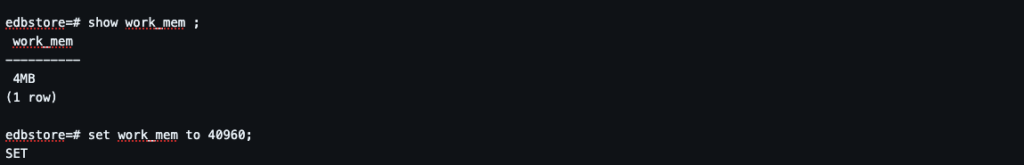
Step 10: Increasing work_mem.
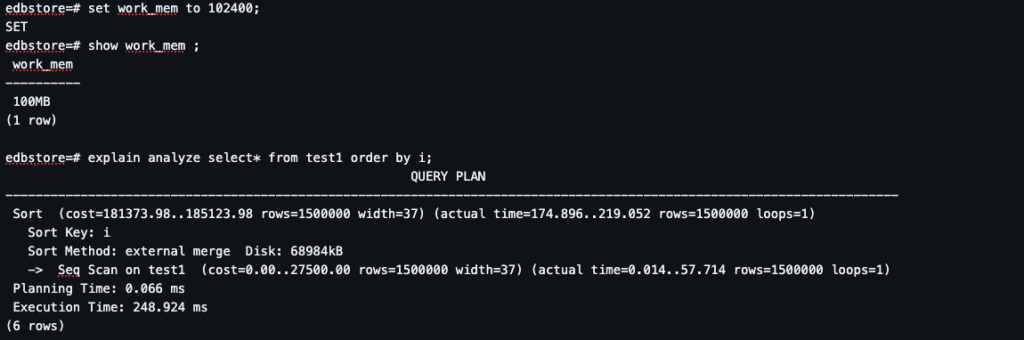
Sort becomes in-memory (quicksort). Faster execution. Reduced disk usage
Final Conclusion
This experiment clearly shows:
✔ Indexing is the biggest performance booster
✔ Parallelism improves large scans
✔ Memory tuning reduces disk spills
✔ Planner cost ≠ actual execution time
Leave a Reply